
|
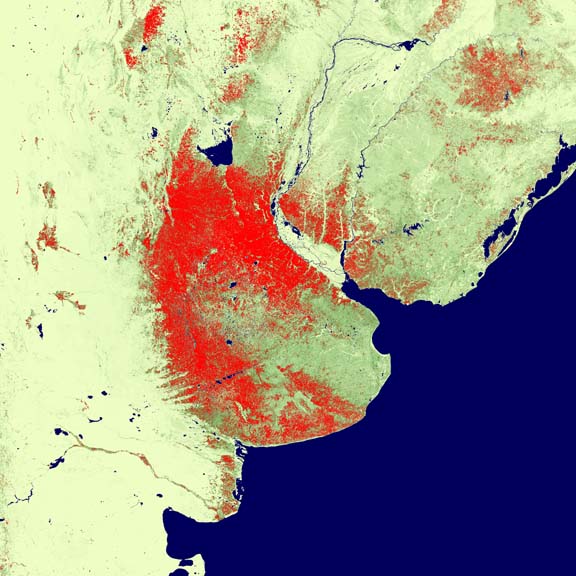
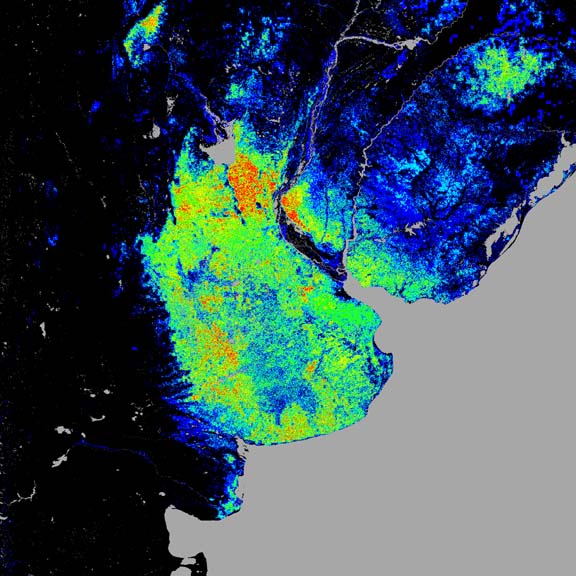
The Argentina/Uruguay/Brazil border area with areas classified as "Cropland" using the area-matching threshold shown in red and cropland probability shown in a beige-to-green gradient for pixels classified as "Not Cropland." The second image is the composite validation map where pixels in red indicated all 5 products agree, yellow means 4 agree, green 3 agree, cyan 2 agree, blue 1 agreed, black 0.
Other high-resolution examples of how the MODIS Cropland Extent product can be seen for the North China Plain, the Indo-Gangetic Plain, and the United States Corn Belt. These data may be used for valid scientific or educational purposes as long as proper citations are used. We ask that you credit the Global Cropland Extent data as follows: Pittman, K., Hansen, M.C., Becker-Reshef, I., Potapov, P.V., Justice, C.O. (2010) Estimating Global Cropland Extent with Multi-year MODIS Data. Remote Sensing, in press. For further information, please contact: Dr. Matthew Hansen Geographic Information Science Center of Excellence - SDSU Phone: (605) 688-6848 Matthew.Hansen@sdstate.edu Kyle Pittman Geographic Information Science Center of Excellence - SDSU Phone: (605) 688-6591 Kyle.Pittman@sdstate.edu Last Updated: 3/11/2010 | ||||||||||||


1021 Medary Ave., Wecota Hall Box 506B, Brookings, SD 57007 · (605) 688-6591